How to Make Charts in Excel Step by Step
Discover how to make charts in Excel easily with this step-by-step tutorial. Learn how to represent your data in a visual way in just a few clicks.

Excel, a powerful Microsoft tool, is not only for organizing data in spreadsheets but also for creating stunning visualizations through charts. In this step-by-step tutorial, we will explain how to make charts in Excel, highlighting the importance of the range of cells, offering suggestions for learning courses, and providing a practical approach to data visualization.
Step 1: Select the Range of Cells
The first step in creating a chart in Excel is to select the range of cells you wish to visually represent. This range should include both the column labels and the data you want to display in the chart. Click and drag to highlight the desired area.
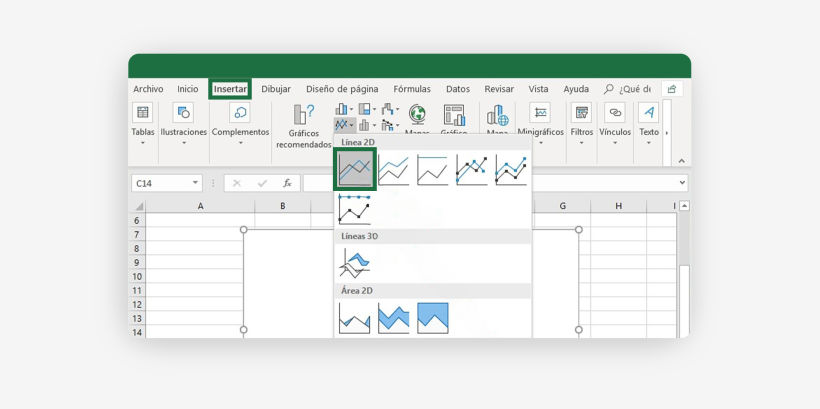
Step 2: Access the "Insert" Tab
Once you have selected the range, go to the "Insert" tab in the Excel menu bar. Here you will find several options, including different chart types such as bar, line, and pie charts. Select the type of chart that best suits your data.

Step 3: Insert the Chart Into the Spreadsheet
Click on the chart type you chose and select the "Insert" option to display the chart in your spreadsheet. This chart will be linked to the range of cells you previously selected and any changes to the data will automatically be reflected in the chart.
Step 4: Customize your Chart
Excel offers numerous customization options. You can change colors, add labels and headlines, and more. Right-click on different chart elements to access formatting and customization options. Make sure your chart is clear and easy to understand.
Step 5: Dynamically Update your Charts
Learn how to use the PivotTables and PivotChart functionality in Excel. These tools allow you to automatically update your charts when the underlying data changes, which is especially useful when working with large and changing data sets.

Step 6: Save and Share Your Work
Once you have created and customized your chart, save your work so you don't lose your changes. You can share your spreadsheet with others or export the chart as an image for use in presentations or reports.
By following these steps, you will be able to create effective charts in Excel and improve your data visualization skills. Remember that constant practice and exploration of educational resources will help you hone your skills in using charts to effectively communicate the information contained in your data.
Explore Learning Courses in Data Visualization
If you want to deepen your data visualization skills in Excel, consider participating in learning courses, such as Domestika's Excel for Creative Projects and Small Business course.
Also, you will surely find this article on How to Subtract in Excel very useful.


0 comments